Manual Web Test Tools
1. Postman is primarily an API testing tool useful for manual testing of web applications' back-end. It is an intuitive graphical interface (GUI) that simplifies sending HTTP requests and analyzing responses.
With Postman, you can perform tasks such as:
- Grouping requests into collections and folders for better organization.
- Using environment variables to share common values across multiple requests.
Blog articles:
- A Comprehensive Guide to Using Postman for API Testing (With Examples)
- Understanding APIs: Simplified Guide for Beginners
2. BrowserStack is a cloud-based platform that lets you test websites across various browsers, devices, and operating systems without needing a local setup.
Video - How to use BrowserStack for Functionality, Usability, and Compatibility testing
3. Burp Suite is a web application security testing platform. It offers an integrated suite of tools designed to identify vulnerabilities in web applications through manual and automated testing methods. The platform enables to intercept, analyze, and modify web traffic, perform vulnerability scans, and conduct security assessments of web-based systems.
4. Google Chrome DevTools
-
Elements Tab — Inspecting Elements
To open the Elements tab for expected elements, Right-click on the webpage (you can also Right-click on the specific element you need to inspect, e.g., button/link), and click Inspect. The Elements Tab provides an opportunity to inspect the website's HTML and CSS, effectively identifying element misalignment and issues with layout.
If you are unfamiliar with HTML and CSS, visit the Introduction to HTML and CSS Introduction pages from W3Schools. Example:
You are testing a form with a lot of input fields (e.g., information for delivery) and you notice that one input field looks different from others. By inspecting the input field in the Elements Tab you can notice that the borders are bigger than others, resulting in a rightward shift. Add this info to a bug report, for faster fixing - bigger borders are a bug root cause. -
Network Tab — Analyzing Network Activity
To open the Network tab for monitoring network activity, Right-click on the webpage, click Inspect, then click the Network tab. The Network tab tracks network activity, recording all resources requested and downloaded by the web page. It assists in identifying slow-loading assets and troubleshooting performance issues.Video: Inspect Network Activity - Chrome DevTools 101
Example: You are testing the webpage load time and notice that the “Contact Us” page is loading very slowly. By checking and analyzing the Network Tab, you can see that an image with the office location is taking too long to load. Add this info to a bug report, for faster fixing. Image optimization will reduce page load time.
-
Sources Tab — Debugging JavaScript To open the Network tab for monitoring network activity, Right-click on the webpage, click Inspect, then click the Sources tab. Sources Tab enables you to set breakpoints, walk through code execution step by step (debugging), inspect variables, and identify JavaScript errors.
Video: Debugging JavaScript - Chrome DevTools 101
Example:
You’re testing a login form on a web app, and the form validation suddenly stops working. By debugging the JavaScript code that handles input validation, you can identify the issue - such as a missing function call or incorrect variable assignment. Add this info to a bug report, for faster fixing. -
Performance Tab — Auditing Web App Speed To open the Network tab for monitoring network activity, Right-click on the webpage, click Inspect, then click the Performance tab. The Performance tab is a tool for assessing web app performance. It allows you to record and analyze metrics, such as load times and rendering processes.
Example:
For the page with a form that you are testing, users have reported slow loading times. By conducting a performance audit using the Performance tab, you can identify issues such as render-blocking resources or large form elements, allowing you to optimize the page for faster loading. -
Console Tab — Logging and Debugging Messages
To open the Console tab, Right-click on the webpage, click Inspect, then click the Console tab. The Console tab serves as an interactive JavaScript console, which allows you to log information, debug code, and run JavaScript commands.Example:
During testing of a form, you want to check if the email validation function is correctly identifying valid and invalid email addresses. You can use the Console tab to log the output of the function when an email is entered. The Console allows you to verify if a function returns the expected result (e.g., true for a valid email and false for an invalid one). Add this info to a bug report, for faster fixing. -
Application Tab — Working with Web Storage
Managing web storage mechanisms like Local Storage, Session Storage, IndexedDB, and Cookies. To access the Application tab, Right-click on the webpage and select Inspect.
Example: During testing, you notice that a user’s login session is not persisting correctly after a page reload:
- Check if the Local Storage or Session Storage contains the expected session token.
- Clear the storage to ensure your app handles missing or invalid data gracefully.
5. Lighthouse (Chrome DevTools) - an open-source tool that measures web performance and provides recommendations for improving load speed, accessibility, and SEO.
6. WCAG - link to the extension - a Chrome extension designed to evaluate color contrast compliance with WCAG accessibility standards.
7. HeadingsMap - link to the extension - a Chrome extension that displays the heading structure of a web page.
8. Accessibility Insights for Web - link to the extension - a Chrome extension and the new Microsoft Edge that assists developers and testers in identifying and resolving accessibility issues in websites and web applications.
9. WAVE - link to the extension - a suite of evaluation tools that helps make web content more accessible to individuals with disabilities. WAVE can identify many accessibility and Web Content Accessibility Guideline (WCAG) errors, but also facilitates human evaluation of web content.
10. Landmark Navigation - link to the extension - this browser extension enables keyboard and menu-based navigation across web page landmark regions. Landmark regions are predefined areas that organize a page's content, such as navigation menus, search bars, and main content sections. The extension allows users to move between these signposted areas quickly, but only when the webpage's author has defined them using WAI-ARIA landmarks.
11. Accessible Web Helper - link to the extension - quickly identifies and resolves web accessibility violations. Powered by WCAG guidelines, Accessible Web Helper streamlines compliance efforts by instantly detecting accessibility issues and eliminating manual spreadsheet tracking.
More info can be found in the following blog: 5 Most Commonly Used Tools for Web Accessibility Testing
How to get browser console logs
Google Chrome
-
Open the console
- Right-click on the webpage, click Inspect
- Click the Console tab
-
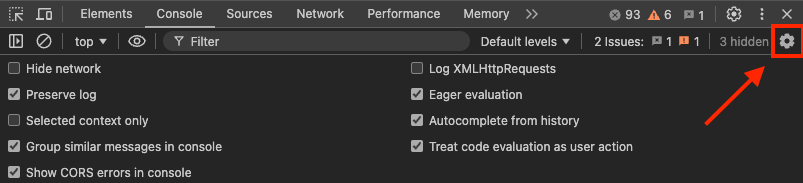
Select Settings
- Click on the Console Setting button
- Select Preserve log
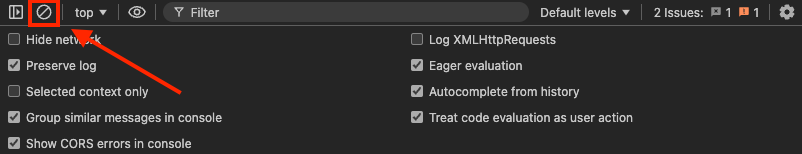
- Start log recording!
- Clear the logs by clicking on the circle icon or press the Ctrl+L keys
- Begin reproducing the issue you've encountered
- Save the logs
- Select all the log text by pressing Ctrl+A on Windows or Cmd+A on Mac
- Right-click on the log screen and select "Save as…"
- Enter a name for the file and save it with a .txt file extension