At TestDevLab we not only offer a wide range of testing services and products like Loadero and Apimation, but also have created advanced testing solutions like Battery & Data usage testing and Audio & Video quality testing. We have written how we test audio quality in VoIP applications before and let’s get an overview of video quality testing. We have prepared a short video that shows how we test video call quality and what parameters we can assess.
Whether a P2P or WebRTC video or audio call — you’ll want to know how your solution performs under different network and device configurations beyond manual testing. We’ll provide the objective measurable results using industry-leading benchmarks of quality and performance. We have blended manual and automated tests into one solution that involves engineers performing a test set and gathering results through a risk assessment to identify areas of potential problems.
Video quality testing as a third party
Received quality of video stream in messaging applications is affected by many aspects such as network quality, algorithms used in video processing and computational power of the device. When testing video stream quality as a third party we can’t access video stream directly. So we are not able to use standard full-reference video quality evaluation tools where you need to provide original and degraded video streams for the algorithm. That is why we have created our own solution to overcome this limitation.
Use cases of our video quality testing solution
A typical application of our video quality evaluation tool is for video stream quality testing in messaging applications at different network conditions on different devices and platforms. Video stream quality testing shows how specific messaging product compares to similar products of competitors. Therefore, it can be estimated what codecs and algorithms the competition is using. Another use case is a comparison of specific product between different releases. Test results also show how good is video stream quality of the specific product on different platforms such as Android and iOS and different devices. We have 700+ real physical devices at our disposal that we can run these tests on and get a precise understanding of real user experience of said app.
Video quality metrics
Our solution evaluates video quality as two different components – frame rate and quality of the image.
The frame rate is evaluated using the marker-based method. Each frame in the test video is overlaid with a unique marker that stores the value of the frame sequence number. The frame rate tool decodes each marker in the recorded video and calculates frame rate at a specified period of time.
Image quality is assessed using BRISQUE (Blind/Referenceless Image Spatial Quality Evaluator) algorithm. BRISQUE is a no-reference image quality evaluation algorithm. It means that you do not have to obtain a reference image for the test image as opposed to full reference and half reference algorithms.
Test setup and procedure
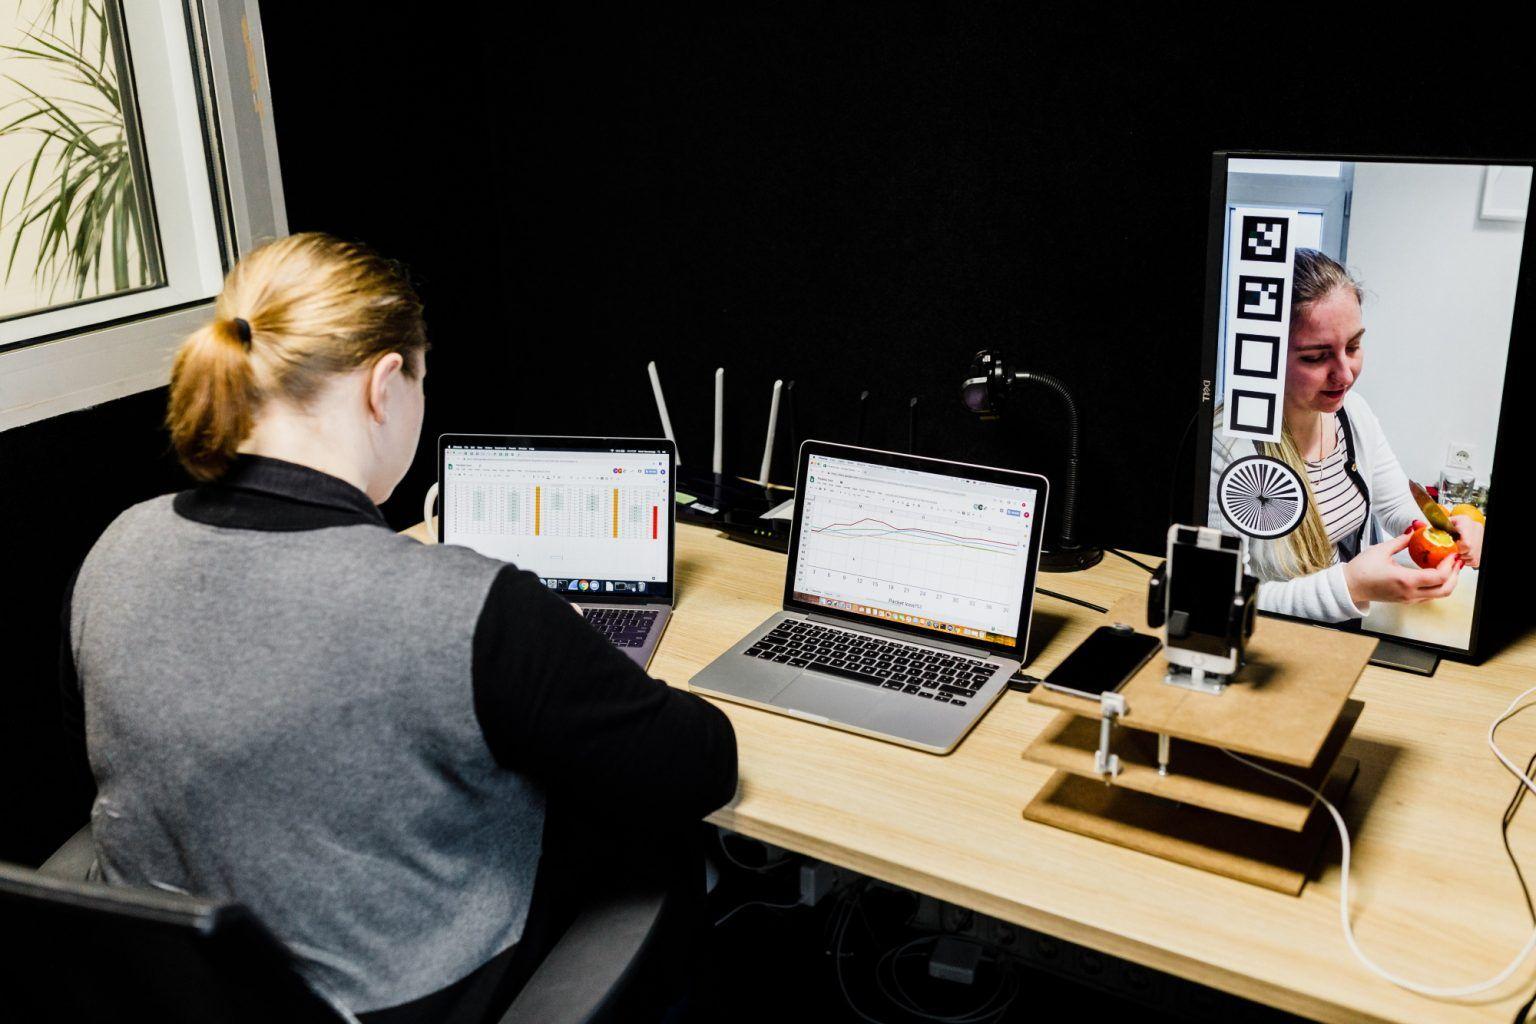
The test setup consists of a sender and receiver device. The sender device is connected to a router where the network parameters can be changed. During the test, the sender device films a video from a PC screen and sends it to the receiver device via application being tested. At the receiver side, the device’s screen is recorded using screen capture software. Recording of video calls is done in a special room where we have consistent lighting. For every condition, we do at least three tests so we get consistent data.

Test video
Video used in testing can be adjusted depending on the purpose of testing. The frame rate of test video must be higher than the frame rate of the application being tested so there are enough frames for application to capture. Test video can be made with or without static screens, that depends on the means of the testing, different applications may handle such static screens differently. The video used in the test is overlaid with a marker for frame rate calculation. The position of the marker could be changed accordingly to the layout of the application’s user interface, so markers do not get covered by some user interface elements. The marker takes approximately 10% of space in video.
Example of marker position in video frame:

Frame rate
One of the most important video quality metrics is the frame rate of the video. Frame rate shows how fluid video is. By analyzing the frame rate metric we are able to find network conditions under which the application is still working. The chart below is an example of a frame rate test at low bandwidth. The chart average values during the call are displayed and we can see that the frame rate of the video is acceptable at network limitation 80 kbps and that is 8 fps (frames per second).

Average values are good at representing the overall tendency, but they don’t show what happens during the call. Conclusions about frame rate characteristics also can be made by looking at the frame rate changes during the call. To express frame rate stability in numbers, the standard deviation can be used that shows how far from average value are the majority of values in the data set. For example, if the average value is 12 fps and the standard deviation is 1.4 fps that means that 68% data in the data set are in the range from 10.6 to 13.4 fps. Another two numbers are the minimum and maximum frame rate.

There are also situations when properties of frame rate could not be expressed using standard metrics. In such situations visual analysis of charts is useful. Here are some examples:


Image quality (BRISQUE)
Image quality shows how good the quality of the video frame is. Image quality score is a number from 1 to 5, where 1 is the lowest and 5 is the highest score. BRISQUE algorithm is trained against our database of images from video calls with human MOS (mean opinion score). The database consists of images with different types and levels of degradations like blurriness, blockiness and noise and combinations of them. The tool calculates feature vector for an image under test and then the regression model predicts image quality score.
The workflow of image quality score prediction:

At the output, the tool gives image quality over time.
Examples of different test results:


If you are building an app that utilizes audio or video streaming, it is critical to understand how it behaves under various network and hardware scenarios. Competition is so fierce nowadays that it is normal to not only monitor your own product’s performance but also keep track of what the competition is doing. We have the tools and experience needed to help you with these tasks.
Interested? Drop us a message and let’s have a call.