As world famous testing professional Amir Ghahrai said – “Testing is about defect detection, Quality assurance is about defect prevention.” Functional testing is concerned only with the functional requirements of a system and subsystem. Non-functional testing demonstrates how well the product behaves as opposed to simply what the product does. Performance testing is a type of software testing which is performed after functional tests. These tests are used to know how the system performs under a particular load. This type of testing should provide developers with the diagnostic information they need to eliminate bottlenecks, slow responses, long load times and issues.
When we want to compare different mobile applications, as a third party service, we do not have developer permissions for specific apps. From mobile applications purchased in the Google Play Store or Apple App Store, we can get CPU, battery and bandwidth data without debug permissions.
Sometimes we use more than two devices for test setups. For example, of four devices, two of them have the same model and operating system. In these tests we compare performance between these two different devices and analyze the results. In these tests we can compare video quality and some small nuances between different models. Once the tests are done, we get needed metrics discussed in this writing.
But first let’s look in to performance setup basics.
The Test Setup

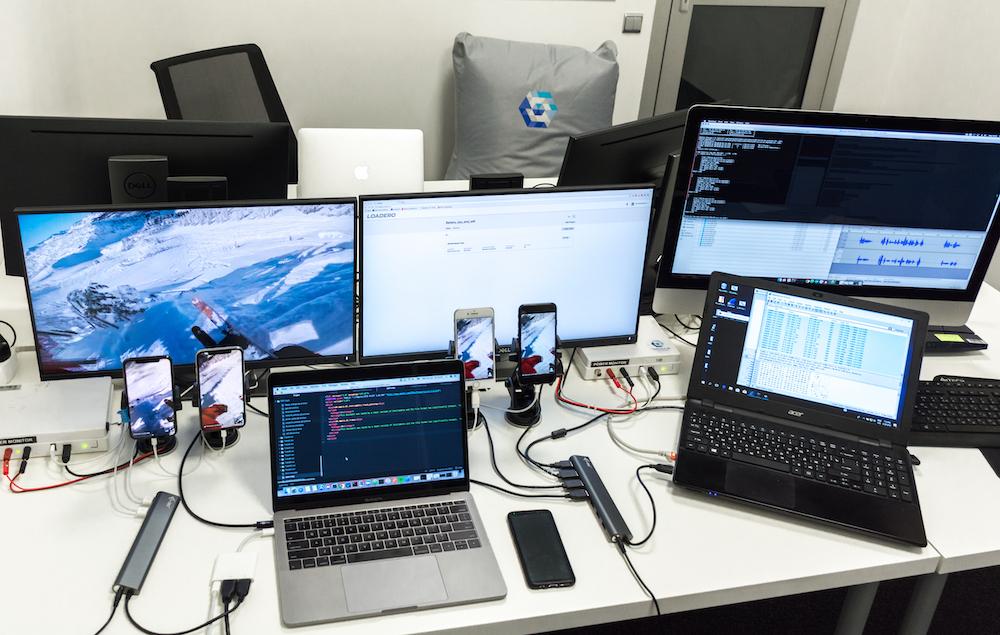
In the Video performance schematic setup we see connections between devices, network and battery hardware.
Test Setup:
- Testing application
- 2 devices (2 iOS or 2 Android)
- Power Monitor Tool and software
- Wireshark software
- Xcode Instruments application (for iOS)
- 1 computer
Metrics to be measured:
- Device battery life (hours)
- Effective stream bandwidth for Mobile or WiFi connection (upstream/downstream/total)
- CPU load for application process and system (percentage)
Test description:
For testing we will use a video conference app. Bandwidth, Battery and CPU data will be collected from one specific device from each pair of Android and iOS test devices. Test duration is 10 minutes.
Why should we test Battery, CPU, and Bandwidth at the same time? It is very important to see what is happening from a black box testing perspective. For example, if there is spike in battery test usage, it makes sense if CPU usage is higher and at the moment when data was received or sent. If the spike shows anomaly and does not correlate with the other measurements we should think why that happened. Let’s see how the performance tests are done on two of the most popular mobile platforms.
Battery tests
Before measuring app battery usage, we do a phone baseline test. A baseline test is done with a device that has been reset. This test shows us how much of the device’s battery is used by background processes, screen, internet, etc. In statistics table we include baseline tests to be sure that we provide measurements of the applications being tested.
Battery tests performed on Android and iOS are similar – with Power Monitor software. We use the Power Monitor (power measurement tool) to provide measurements. Power Monitor can collect 5000 samples per second that gives accurate measurements. The test device is attached to Power Monitor and it is connected to a computer. Please see Battery test setup.

We have looked into testing of Mobile Application battery usage in our previous post, you can read it here. Plus, here’s a recording of our webinar on this topic.
Only for Android platform we can get battery usage from Batterystats. “Batterystats is a tool included in the Android framework that collects battery data on your device. You candump the collected battery data to your development machine and create a report you can analyze using Battery Historian. Battery Historian converts the report from Batterystats into an HTML visualization that you can view in your browser.”
Also, only on iOS platform we can do battery tests using Xcode Instruments – “Energy log”. “Use the Energy Log profiling template to monitor a variety of factors that affect energy usage on an iOS device, including CPU activity, network activity, screen brightness, and more. Identify the areas where usage is highest, and see if you can reduce impact in those areas.
The Energy Usage instrument indicates a level from 0 to 20, indicating how much energy your app is using at any given time. These numbers are subjective. If your app’s energy usage level is occasionally high, it doesn’t necessarily mean that your app has a problem. Your app may simply require more energy for some of the tasks it performs. For example, it may use the GPS while performing complex network operations. This is valid energy use. Look for spikes or areas of high energy use that are unexpected or that could be performed at more optimal times.” Apple Inc 2018
For more details on how to record logs or import it from the iOS device please see this article.
CPU and Battery Profiling for Android devices
We can profile CPU and Battery at the same time by following these steps. As we see in the Battery test setup picture, the phone is initially connected to the USB port. Battery box captures information from the device when the test starts and then disconnects the USB from the device. After the test ends, battery box reconnects to the device and collects CPU information from it. To capture the CPU and Battery data in the same time, we need to clear battery stats and write adb devices command to know if the device is connected to the computer. Then clear the battery stats
$ adb shell dumpsys batterystats --reset
$ adb shell dumpsys batterystats --enable full-wake-history
After that you can start the software which capture samples from the battery box. When your test is finished type adb bugreport command to get android bug report files for later information analysis.
Profile CPU usage with bug report
One way to measure CPU performance and other important information for Android is by using adb bugreport. A bug report contains diagnostic information that can help identify and fix bugs in applications. We can capture bug reports from a device by the following steps. First of all device must have Enabled developer options.
When developer options are enabled, connect the phone to the computer and double check if the phone has granted access. Open terminal and type in adb devices command that will show your phones serial number*.
$ adb devices
List of devices attached
device_serial_number         device
If you have one device connected, you can get the bug report by using adb as follows:
$ adb bugreport ~/path_for_your_reportYou can save your bug report on your own provided path. If you do not specify a path for the bug report, it will be saved to the local directory. For multiple connected devices you must specify the device with the -s option.
$adb -s device_serial_number bugreport* You can get the device serial number by using adb devices command.
By default the zip file is called bugreport-BUILD_ID-Date.zip and it may contain multiple files, but the most important one is the bugreport-BUILD_ID-DATE.txt file which contains all the diagnostic information (dumpsys, dumpstate and logcat).
For easier Bug report viewing you should set up Battery historian on your own machine see the repository : https://github.com/google/battery-historian
Example:
1. Upload your bug report file to the battery historian viewer that you set up

2. After the report has been submitted and opened by the Battery Historian, go down to the System stats and find CPU Usage and sum User time + System time (Don’t forget to convert everything into seconds!) if you want to find out the overall CPU usage of the device.

3. If you want to find out the CPU usage for a specific process, filter your application by its package name and sum CPU user time + CPU system time.

CPU GOLDEN RULE = CPU%

First you need convert minutes to seconds

In 600 seconds test, system uses 13.21% CPU

In 600 seconds test, CPU usage by the application is 6.65% . This is the most reliable way of acquiring CPU information. In third party CPU measurement software Applications it’s usually not mentioned how the result has been either calculated or measured, so we can’t know if the result displayed is divided by the number of cores, divided by a wrong number or cores, or shown plainly. Using CPU formula, obtained result coincides with information in Android Studio – Activity Monitor.

Profile CPU usage from ADB
The easiest way to display CPU processes is by using ADB (Android Debug Bridge) command line tool, that lets you communicate with the device.
1. This command shows percentage CPU activity in top 20 applications:
$ adb shell top2. With grep command we can choose one specific process on a Unix machine:
$ adb shell top | grep "com.android.sys"We use this method a couple of times during test for specific application process and obtain average value of CPU usage. For more information please see Android Debug Bridge (adb) documentation.
Profile CPU usage of iOS devices with Xcode
Getting CPU results from iOS is easier than you think. You only need Xcode developer Tools and Instrument tool. As we know Xcode Instruments allow to record CPU information only when we have developer permission. If you record your process locally on phone and then import to Xcode instruments then you can get All CPU information. To measure CPU% usage we use Energy log in Xcode Instruments tool. Note that the Xcode version must support the latest iOS version on mobile device.
First you need to connect the device to computer and open Xcode instruments on your computer. In the device open Settings -> Developer -> Logging and press Start Recording. After test stops recording, open Xcode Instruments on your computer, chose the device and app.

After that you can import logged data from device. Open File in menu and choose Import Logged Data from Device

After that you see the device CPU activity in “CPU Activity Log” option.
Effective bandwidth measurement with Wireshark (works for both Android and iOS devices)
On our blog we have already described how to set up specific network conditions for software testing needs. This post will basically recreate the measurement setup.
We can profile CPU, Battery and Bitrate or Effective Bandwidth usage simultaneously from a selected device. To get the 3 results, use a script to start Wireshark packet capture, run Android Debug Bridge logging and capture samples from Power Monitor hardware. After the test, to check the consumed bandwidth data, type the device IP address into the Apply a display filter input field. Open Statistics menu and choose Conversations option.

After the filtering is done, Wireshark will open a “Conversations” window

In this window, each row in the list shows the statistical values for one conversation and we can select TCP or UDP stream statistics for total Tx/Rx Bytes, Packets and also the average Bitrate. Additionally IP address DNS resolution can be enabled in Statistics to display meaningful domain entries. For more information about Conversation and Endpoint types please see Wireshark documentation.
Bandwidth measurement for iOS devices
Also, only for iOS we can get network data traffic using Xcode instruments – “Activity Monitor” and “Network” profiles. “The Activity Monitor profiling template uses the Activity Monitor instrument to track overall system activity over time, including CPU, memory, network, and disk. By default, the Activity Monitor template doesn’t display network or disk activity in the timeline pane. However, you can manually enable the display of these statistics.
The Network profiling template uses the Connections instrument to analyze your iOS app’s TCP/IP and UDP/IP connections.”
First you need to connect the device to computer and open Xcode instruments on your computer. In the device open Settings -> Developer -> Logging, enable Network option and press Start Recording. After test has stopped recording, open Xcode Instruments on your computer and import logged data from the device. In the first 20 seconds of the test cellular data was enabled and after few more seconds was changed to wifi. In picture we see sent and received data average.

Bandwidth measurement for Android devices
Only for Android platform you can get network Information using Battery Historian. When you get a bug report file from the device, upload it to Battery Historian. There are multiple accordion dropdown menus – Network Information, Services, Process info and Sensor Use. In picture you see the averages of sent and received packets.

To save time we automated CPU, Battery and Wireshark tests for Android and iOS to run them at the same time. For more information contact us.
In these examples we wanted to show you how we can get some basic and necessary metrics without developer permissions. The only thing you need is an app to be able to test. But when we have developer permissions, Android and iOS tools allow debugging and automation in the platform-specific IDE environment. Also keep in mind that third party measurement tools may be unreliable and and display inaccurate metrics. Because they usually don’t mentioned how the result has been calculated or measured. For example, the above topic is about the processor.