

When teams think about AR and VR testing, they usually focus on features and user flows. But for many products, the real risks sit in non-functional behaviour:
- Does the experience drain the battery too fast?
- How hard does it push the CPU?
- How much memory does it need in real use?
This article walks through how we approach non-functional performance testing across three very different types of AR/VR headsets. Each device represents a distinct category of wearable computing, and each tells a completely different story when you look under the hood.
We capture and analyse three core signals across all devices:
- Battery usage in milliwatts (mW)
- CPU usage in percent (%)
- App memory usage in megabytes (MB)
TL;DR
30-second summary
What do battery, CPU, and memory measurements actually reveal about how AR/VR headsets perform under real conditions?
- The Xreal One and Meta Quest 2 represent fundamentally different power profiles because they're fundamentally different devices. The Xreal One is a passive wearable display with no onboard compute, relying entirely on a connected phone to run everything. The Meta Quest 2 is a fully standalone VR headset with its own battery, CPU, and storage. Comparing their raw power numbers directly is meaningless; comparing their patterns of behavior is where the insight lives.
- For the Xreal One, the dominant power cost is the display connection itself, not the content. A Samsung A54 running alone idles at roughly 65 mW. Connecting the Xreal glasses pushes that to approximately 2,840 mW at idle, an increase of over 40x, before any content plays. Streaming 4K video adds only a further ~560 mW on top of that connection cost.
- The Meta Quest 2 draws heavily at idle, leaving little headroom between doing nothing and doing something demanding. Idle baseline sits at roughly 5,650 mW, and even heavy Job Simulator gameplay only adds ~200 mW above that, a 3.5% increase. Battery life on the Quest 2 is determined more by how long the headset is powered on than by what's actually running on it.
- CPU usage on the Quest 2 stays low even under heavy interaction, pointing elsewhere for the real power cost. Job Simulator light and heavy usage both sit in the 8–10% average CPU range, with only a 0.7 percentage point difference between them. The additional energy cost of active gameplay is more likely driven by controller processing, haptics, and rendering than raw CPU load.
- Memory growth during Quest 2 sessions is the metric worth watching over longer runs. Light usage added ~234 MB of memory over 10 minutes; heavy usage added ~512 MB. This isn't necessarily a leak, since VR engines commonly load assets progressively, but distinguishing normal caching from a genuine memory management issue requires testing sessions longer than 10 minutes.
Bottom line: Across both device categories, the cost of keeping AR/VR hardware active is often higher than the cost of the content running on it. Feature testing tells you whether a product works; non-functional testing tells you whether it's ready for real users to wear it for more than a few minutes.
The devices: Three very different beasts
Not all AR/VR headsets are the same. The three devices we test here represent fundamentally different computing architectures, which is exactly why comparing them is so instructive.
Xreal One - Wearable Monitor
The Xreal One is best understood as a wearable display. The glasses themselves have no onboard compute. Instead, they take the output from a connected phone and present it in front of your eyes. Think of it as wearing a large private screen on your face rather than a spatially-aware AR device.
- Host device: Samsung Galaxy A54
- What we measure: Battery is measured on the phone because that is where everything actually runs
- Why this matters: This is the most common real-world configuration for Xreal users, making it a realistic and representative test setup
Scenarios tested: Device baseline (phone alone), idle with glasses connected, 4K video playback. Meta Quest 2 - Standalone VR Headset
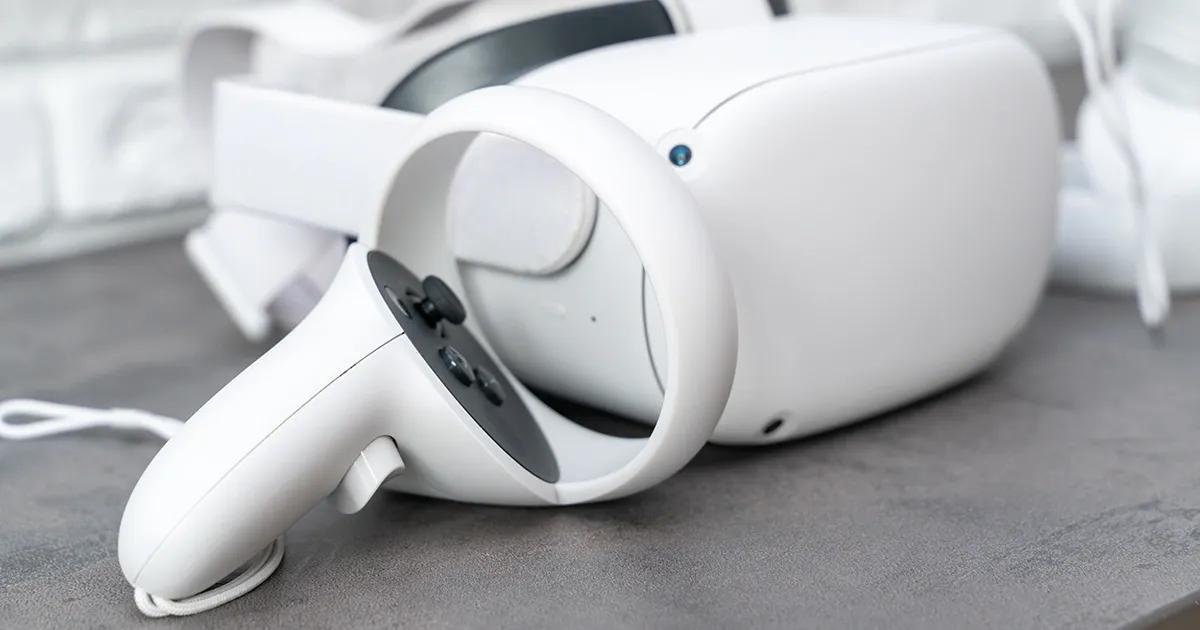
The Meta Quest 2 is a fully self-contained VR headset. It needs no phone or PC to operate. All compute, storage and power live inside the device itself.
- Measurement method: Monsoon power monitor connected directly to the headset for high-precision mW readings. CPU and Memory was captured using adb commands
- What we measure: Battery, CPU and memory directly on the device while the target application is running
- Why this matters: The Monsoon gives us hardware-level power data rather than software estimates, making the results significantly more accurate
Scenarios tested: Idle baseline, 4K video playback, Job Simulator light usage, Job Simulator heavy usage
Meta Glasses (Ray-Ban Meta) - Smart Glasses
The Meta Glasses are a different category entirely. These are ambient computing glasses designed for everyday wear, built around hands-free capture, open-ear audio, calls and Meta AI integration. They are not an immersive display device.
Methodology
Why Monsoon?
Consumer devices expose battery data through software APIs, which report averaged, estimated values. A Monsoon power monitor bypasses the software layer entirely, measuring actual current draw at the hardware level. This gives us precise instantaneous milliwatt readings that software tools simply cannot match.
For the Xreal setup, the Samsung A54 was the battery device. Its power draw was measured directly, capturing the full cost of driving the glasses across all scenarios.
Test duration and consistency
All tests ran for 600 seconds (10 minutes). Where longer recordings were taken, data was trimmed to this window to ensure every scenario and every device is compared on equal footing. Each scenario was run across three independent trials where possible, allowing us to distinguish genuine behaviour from run-to-run noise.
A note on Xreal CPU and memory
Because the Xreal glasses are a passive display with no onboard compute, CPU and memory measurements were not captured for this device in the current test set. All meaningful processing happens on the host phone, and power draw alone gives a clear picture of the phone's workload across scenarios.
Metrics explained
Three signals drive every comparison in this report. Here's what each one actually tells you.
Battery usage (mW)
Instantaneous power draw in milliwatts. This shows how expensive a given scenario is in energy terms and how different devices and use cases compare over time.
CPU usage (%)
App-level CPU utilisation across the duration of each scenario. For the Quest 2, this is the CPU consumed specifically by the application under test, not total device CPU. This helps identify whether a scenario is light, moderate or heavy from a processing perspective, and whether sustained high-load periods could cause thermal throttling.
App memory usage (MB)
Memory consumed by the application under test. We track both average and peak values, as well as trends over time, steady growth during a run can indicate memory leaks or inefficient resource management that would only surface in longer sessions.
Test scenarios
To make the numbers meaningful, we ran each device through a set of scenarios chosen to reflect real usage, from doing nothing to pushing the hardware hard.
Xreal One scenarios
| Scenario | Description |
|---|---|
| Device baseline | Samsung A54 running with no glasses connected - establishes the phone's natural idle power floor |
| Glasses idle | Glasses connected and active but no content being consumed - isolates the cost of the connection itself |
| 4K video playback | A 4K video streamed through the glasses for the full test duration - the primary real-world use case for this device |
Meta Quest 2 scenarios
| Scenario | Description |
|---|---|
| Idle Baseline | Headset on and active but no application running - establishes the device floor |
| 4K Video Playback | A 4K video played on the headset for the full test duration |
| Job Simulator - Light | Wearing the headset in the VR environment with minimal interaction - mostly looking around |
| Job Simulator - Heavy | Actively playing the game with frequent hand interactions, object manipulation and task completion |
Results
With the scenarios defined, here's what the data actually showed, starting with battery, the metric where the two device categories differ the most.
Xreal One - Battery (mW)
The most striking finding from the Xreal data is how significant the cost of simply connecting the glasses is.
| Scenario | Median mW | vs Phone Alone |
|---|---|---|
| Device Baseline (phone only) | ~65 mW | - |
| Glasses Idle (glasses connected) | ~2,840 mW | +2,775 mW |
| 4K Video Playback | ~3,400 mW | +3,335 mW |
The phone alone at idle sits at around 65 mW - a very low baseline. Connecting the Xreal glasses immediately pushes this to approximately 2,840 mW, an increase of over 40x, simply to maintain the display connection at idle. Streaming 4K video adds a further ~560 mW on top of that.
This tells us something important. For the Xreal One, the dominant power cost is not the content being displayed, it is the act of powering and maintaining the display connection itself.

All three runs showed consistent startup spikes in the first 10–20 seconds as the device initialised, settling to stable values thereafter. Occasional background OS events caused brief spikes in some runs, demonstrating why multiple trials matter - single runs can be misleading.
Meta Quest 2 - Battery (mW)
The Quest 2 operates in a fundamentally different power range from the Xreal phone measurements, reflecting its status as a purpose-built standalone VR device with its own dedicated battery and compute.
| Scenario | Median mW | vs Baseline |
|---|---|---|
| Idle Baseline | ~5,650 mW | - |
| 4K Video Playback | ~5,720 mW | +70 mW |
| Job Simulator - Light | ~5,700 mW | +50 mW |
| Job Simulator - Heavy | ~5,850 mW | +200 mW |
Several things stand out here. First, the Quest 2 baseline idle is already substantial, approximately 5,650 mW just to keep the headset active. This reflects the cost of running a full Android-based operating system, displays, sensors and tracking hardware continuously.
Second, the delta between scenarios is relatively small. 4K video and light gameplay sit within 50–70 mW of the idle baseline. Only heavy active gameplay pushes consumption meaningfully higher, adding approximately 200 mW above baseline.
This suggests the Quest 2 is already drawing close to its operational ceiling at idle, with relatively limited headroom between doing nothing and running demanding content.

Meta Quest 2 - CPU (%)
CPU data was captured for both Job Simulator scenarios, giving us a direct view of how interaction intensity affects processing load.
| Scenario | Avg CPU % | Peak CPU % |
|---|---|---|
| Job Simulator - Light | ~8.5% | ~15% |
| Job Simulator - Heavy | ~9.2% | ~14.5% |
App-level CPU usage is consistently low across both scenarios, sitting in the 8–10% range on average. This is an important finding: even active VR gameplay does not push the application's CPU demand particularly hard. Peak values occasionally reaching 14–15% appear to correspond to scene transitions or loading events rather than sustained gameplay load.
The difference between light and heavy usage is modest at the CPU level (~0.7 percentage points on average), suggesting that the interaction cost in Job Simulator is not primarily CPU-bound. The power data tells a more complete story. The additional energy cost of active gameplay is more likely driven by increased controller processing, haptics and rendering workload than raw CPU utilization.

Meta Quest 2 - App Memory (MB)
Memory was tracked for both Job Simulator scenarios across the full 600 second window.
| Scenario | Starting Memory | End Memory | Growth |
|---|---|---|---|
| Job Simulator - Light | ~898 MB | ~1,132 MB | +234 MB |
| Job Simulator - Heavy | ~916 MB | ~1,428 MB | +512 MB |
Both scenarios show consistent memory growth over the test duration. This is not necessarily indicative of a memory leak - VR engines commonly load assets progressively as scenes are explored. However, the rate of growth is notably higher in heavy usage, where the application adds approximately 512 MB over 10 minutes compared to 234 MB in light usage.
This pattern is worth monitoring over longer sessions. A test run extended to 30 or 60 minutes would reveal whether the growth plateaus (normal asset caching) or continues linearly (potential memory management issue).

Want to know how your product performs under real conditions?
These numbers only mean something in context, against your own device, your own app, and your own usage patterns. Our battery and data usage testing service applies the same hardware-level measurement approach to your product.
Key takeaways
Pulling the numbers together, three clear patterns emerge, one for each device, and one that applies across the board.
Xreal One
The single most significant finding is the cost of the display connection itself. Connecting the Xreal glasses increases phone power draw by over 40x compared to the phone running alone - from ~65 mW to ~2,840 mW at idle. Playing 4K video adds a further ~560 mW on top.
For teams building products targeting this device type, this means battery life planning must account for the constant overhead of maintaining the display connection, not just the workload of the application. An app that is "lightweight" in isolation may still drain the host phone rapidly simply because the glasses are connected.
Meta Quest 2
The Quest 2 tells a different story. Its baseline power draw is already high (~5,650 mW) and the delta between idle and active scenarios is relatively small. Heavy gameplay only adds ~200 mW above baseline - a 3.5% increase over a device that is already drawing significant power at rest.
This has practical implications: Battery life on the Quest 2 is more determined by how long the headset is on than by what it is doing. An idle headset and an actively used headset consume similar amounts of power.
CPU usage remains low and consistent across gameplay intensities, suggesting the application is not CPU-constrained. Memory growth is the metric to watch, particularly in longer sessions or more complex scenes than those tested here.
Cross-device
The two platforms are not directly comparable in power terms. The Xreal phone baseline and the Quest 2 standalone draw are measuring fundamentally different things. What they share is a clear lesson: the cost of keeping AR/VR hardware active is often higher than the cost of the content itself.
Why non-functional testing matters for AR/VR
Feature testing tells you whether your product works. Non-functional testing tells you whether it is ready for real users.
In AR/VR products specifically, non-functional testing is particularly important, as the stakes are higher than in a typical app:
- A device that drains in two hours will frustrate users regardless of how polished the experience is
- Sustained high CPU load leads to heat, throttling and degraded frame rates - all of which break immersion
- Memory growth over a session can cause crashes that are nearly impossible to reproduce in short manual test runs
The goal of this type of testing is not to find a single number. It is to build a complete picture of how a product behaves under realistic conditions, across the scenarios real users will actually encounter, on the hardware they will actually use.
If you are building an AR/VR product and want to understand its non-functional behaviour before it reaches your users, get in touch with us.
FAQ
Most common questions
Why does connecting AR glasses to a phone cause such a large increase in power draw?
For a passive wearable display like the Xreal One, the glasses have no onboard compute and rely entirely on the connected phone to run everything. Testing showed the phone's power draw jumping from roughly 65 mW alone to approximately 2,840 mW simply from connecting the glasses, an increase of over 40x before any content is streamed. This shows that for this device category, maintaining the display connection itself is the dominant power cost, not the content being shown.
Why does battery life on a standalone VR headset depend more on time worn than content played?
On the Meta Quest 2, idle baseline power draw is already substantial at roughly 5,650 mW, reflecting the cost of running a full operating system, displays, sensors, and tracking hardware continuously. Even heavy, interaction-intensive gameplay only adds approximately 200 mW above that baseline, a 3.5% increase. Because the gap between doing nothing and doing something demanding is so small, how long the headset stays powered on matters more for battery life than what's actually running on it.
Why is CPU usage low even during active VR gameplay?
Testing on the Meta Quest 2 found app-level CPU usage stayed in the 8–10% average range across both light and heavy interaction scenarios in Job Simulator, with only a 0.7 percentage point difference between them. This indicates the application isn't CPU-constrained even under active gameplay. The additional power cost observed during heavy usage is more likely driven by controller processing, haptics, and rendering workload rather than raw CPU utilization.
How can teams tell if memory growth in a VR app is a leak or normal behavior?
Memory growth alone isn't necessarily a sign of a leak, since VR engines commonly load assets progressively as a scene or environment is explored. In testing, light Quest 2 usage grew memory by roughly 234 MB over 10 minutes, while heavy usage grew it by roughly 512 MB. Distinguishing a memory leak from normal asset caching requires extending test sessions well beyond 10 minutes to see whether growth plateaus or continues linearly.
Why is a Monsoon power monitor used instead of software-based battery reporting?
Consumer devices expose battery data through software APIs that report averaged, estimated values rather than actual measurements. A Monsoon power monitor bypasses that software layer entirely, measuring real current draw at the hardware level and producing precise, instantaneous milliwatt readings that software tools can't match. This hardware-level approach is what makes it possible to see effects like the exact cost of connecting a display, rather than an approximation smoothed out by the OS.
What would a Monsoon power monitor reveal about your device?
We apply the same hardware-level measurement approach used in this report to your own device, your own app, and your own usage patterns.